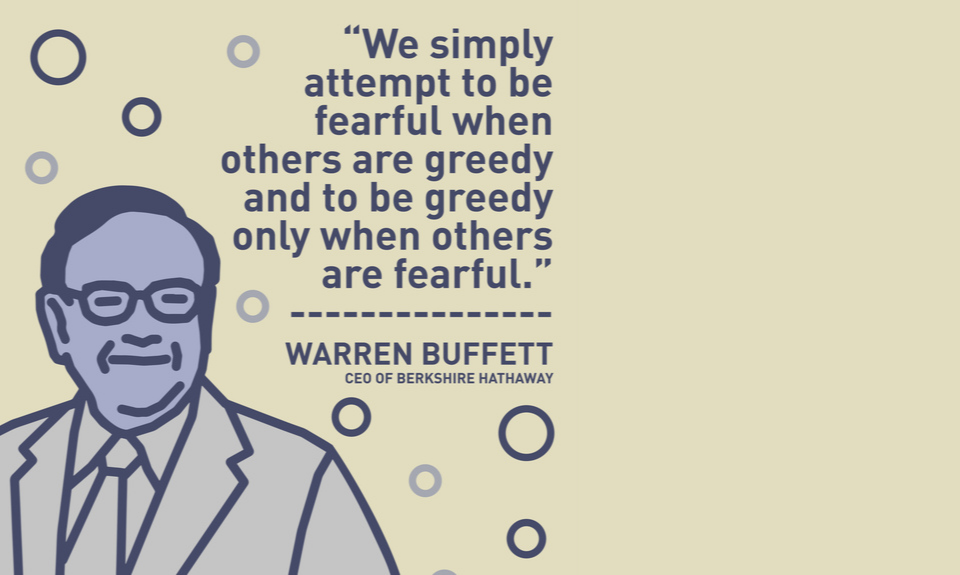
Warren Buffett[1] is generally considered to be one of the world’s most talented investors. Most observers and his admirers highlight his talent for picking stocks, and attribute this to his ability to keep a level head and not go in for fads. His recurrent impressive performances over a forty-year period have made him a legend, contradicting the efficient market hypothesis according to which no investor can consistently beat the market.
So what is the real story? Does his performance demonstrate a special talent, or is it all down to luck?
Is Warren Buffett an outlier?
According to Cornell and his co-authors, yes, Warren Buffett is a statistical outlier, like the person that wins the lottery. And yet, although a lottery win represents an amazing return on investment, it does not make you a visionary investor, nor does it mean that buying a lottery ticket is a good investment strategy.
According to Cornell, it is difficult to say whether it is talent that has enabled a portfolio manager to regularly beat the market. To illustrate this, he gives the example of two coins:
- The first is a fair coin, with a 50% chance of turning up either heads or tails.
- The second is an unfair coin, with a 60% chance of turning up heads.
Imagine that we give an investor one of the two coins. How many times will they need to toss the coin to be 95% sure which one they have in their hand? According to the experiment, 143 times!
By analogy, determining whether Buffett’s success is down to luck or talent would require a deep dive into a very large number of financial profitability calculations. Cornell nevertheless admits that Buffett is not just a lucky investor, and that his qualities suggest the opposite.
When his company’s performance is analysed in more detail, it appears to be declining over time. Average performance over the first three decades is indeed remarkable; over the last three decades however, it has fallen. In addition, a closer look at the decade 2011-2020 shows that the company actually underperformed the S&P 500 by 0.33% on average, and by a full 6.57% over the last three years.
So a detailed examination of Berkshire Hathaway’s performances demonstrates just how difficult it is to beat the market.
| Geometric average return | Berkshire (%) | S&P 500 (%) | Berkshire outperformance |
| 1964-1974 | 12.45 | 1.39 | 11.07 |
| 1975-1984 | 41.01 | 11.05 | 29.96 |
| 1985-1994 | 23.50 | 11.25 | 12.25 |
| 1995-2004 | 9.93 | 6.34 | 3.59 |
| 2005-2016 | 8.80 | 7.07 | 1.73 |
| 1964-2016 | 20.94 | 9.78 | 11.16 |
So what is behind Buffett’s performance?
Frazzini, Kabiller and Pedersen carried out a detailed study of Berkshire Hathaway’s performance, distinguishing between Warren Buffett’s stock-picking skills and his talent as a business manager. There are two parts to the company’s assets: private equity (65% on average between 1980 and 2017) consisting of holdings in unlisted companies, and a portfolio of listed stocks (35% on average). The private equity side has grown constantly from 20% in 1980 to 78% in 2017. The performance of the portfolio of listed stocks demonstrates Buffett’s talents as a portfolio manager, whereas the performance of the private companies he owns demonstrates his business management abilities. It is important to stress that Berkshire Hathaway is not an investment fund, but a company. It is not subject to the same limitations as a mutual fund:
- Berkshire Hathaway does not have to deal with the issue of investors buying and selling units. Consequently, it is not impacted by market fluctuations in the way that mutual funds are:
- when the market rises, Berkshire Hathaway does not see an inflow that it needs to invest,
- and when the market falls, it does not have to sell investments to buy back the units that investors want to cash in.
So it is easier for Warren Buffett than for a mutual fund manager to bet against the market by buying at low points.
- In addition, he is not bound by the same short-term performance constraints as mutual funds. As the authors highlight, between 30 June 1998 and 29 February 2000, Berkshire Hathaway’s share price fell 44%, whereas the market rose 32%. It is unlikely that the average fund manager would have survived their fund underperforming the market by 76%!
- Lastly, the final difference compared to a standard fund is that Berkshire Hathaway carries debt on its balance sheet, which creates a leverage effect and increases its equity returns.
As the authors point out, the fact that the company’s profitability is partly down to standard factors does not take any of the credit away from Warren Buffett, especially as the factors were highlighted after he put them into play.
Empirical studies of the standard profitability factors show an alpha value close to zero. As the managers of the global investment firm AQR have pointed out, alpha may just be beta waiting to be discovered. In conclusion, the performance of Berkshire Hathaway is attributable not to luck, but to always choosing securities with certain characteristics. And that is where Warren Buffett is so talented.
Does this mean Buffett’s performances could have been predicted?
Statman and Scheid looked at whether Berkshire Hathaway’s extraordinary performance provides any indications as to its future performance. The fact that it is a listed company and not an investment fund is fundamental to their analysis. As a listed company, its share price reflects investors’ predictions of its future performance, whereas the value of an investment fund simply reflects the net value of its asset portfolio. On 10 May 1965, the day Warren Buffett took control of the company, a Berkshire Hathaway share could be bought for $18. On 31 December 2000, the final day analysed by the authors, it was worth $71,000. The annualised return of Berkshire Hathaway shares over the period was 26.18%, compared to 11.69% for the S&P 500 index. But does this result mean that it made sense to invest in the company in 2000?
Many investors fell into the trap of assuming that past performance would continue because it was not down to chance. Warren Buffett was recognised in the 1970s as one among a number of leading investors named by the authors, but the others suffered some below-par results, whereas Buffett himself continued to outperform the market. Based on the principle that the current price of a share is the sum of the discounted values of all its future cash flows, as they are foreseen by investors, Warren Buffett’s talent must have been taken into account in share prices. Statman and Scheid test the hypothesis that if investors had been capable of predicting the share price seen at the end of 2000, i.e. if they had correctly predicted Buffett’s talents as a manager, the 10 May 1965 price ($18) would have been $1383, or 77 times higher than it actually was. With hindsight therefore, it is unreasonable to claim that investors saw what was coming. It is easier to predict the past than the future! Spotting Buffett’s genius based on his past performance is simple, but it is more difficult to predict who the next Warren Buffett will be.
Analysing Berkshire Hathaway’s performance shows without a shadow of a doubt the prodigious talent of its main manager, Warren Buffett. Authors that have written about him do not deny this. The main questions for today’s investors are: to what extent is it possible to foresee who the next manager of Buffett’s calibre will be, and, is it possible to spot them based on the past profitability of funds. That no doubt remains a very difficult exercise.
[1] We hear much about Warren Buffett, but far less about Charles Munger, his business partner of over 40 years. The performance of their company, Berkshire Hathaway, can be attributed to both men. Nevertheless, Warren Buffett has by far the higher media profile, and is the wealthier of the two. Consequently, this note will concentrate mainly on him.


